
For the ETC Standard Pask Permeameter, the applicable Kfs range would be:
10-8 m/sec to 10-4 m/sec
The estimated applicable Kfs range for the ETC Slow Soils Pask Permeameter would be:
10-9 m/sec to 10-6 m/sec.
The Slow Soils (SS) Pask Permeameter (which comes in the ETC Comprehensive Pask Permeameter Kit), is a variation of the ETC Standard Pask Permeameter. It is better suited for testing very slowly permeable soils such as: clay, silt, silt loam, clay loam, loam, sandy silt, etc. It is also ideal for engineering consultants and others who conduct quality control testing in the field on compacted clay liners for lagoons, stormwater ponds and landfills.
The Slow Soils permeameter (SS) has a much smaller reservoir diameter than the Standard Pask Permeameter. For every milliliter (ounce) of water which flows out of the well hole into the soil, there will be a larger drop on the smaller diameter SS reservoir compared to the Standard Pask Permeameter. This makes it more accurate at the lower (slower) end of the Kfs range because it is easier to detect drops for small volumes of water on the scale of the Slow Soil Permeameter reservoir. So for testing very slowly permeable soils, the results obtained with the SS permeameter will be more accurate, and it also won’t take as long to run a test (to reach steady state conditions).
Our ETC Simplified Falling Head Permeameter Kit is for testing disturbed samples of very clean, sandy soil or fill with a low fines (silt + clay) content. It can be used to conduct a test in a laboratory or office or in the field, at a job site, or at a sand stockpile. A test on a clean, fast sand can typically be completed in 15min to 60min. This kit is NOT for testing natural soil or sand deposits in situ (in-place) or for testing soils with more than 10% silt+clay content. Use our Standard Pask Permeameter Kit instead.
Our device is meant to be simple and fast to use and economical to purchase, but that means there are some limitations compared to other more expensive instruments. So we cannot offer extensions to go deeper.
The practical maximum depth of a test is about 60 cm below ground surface with the Standard Pask without removing any of the upper soil layer. Users could test to a greater depth (like 80cm) with the Slow Soils Pask Permeameter without removing soil.
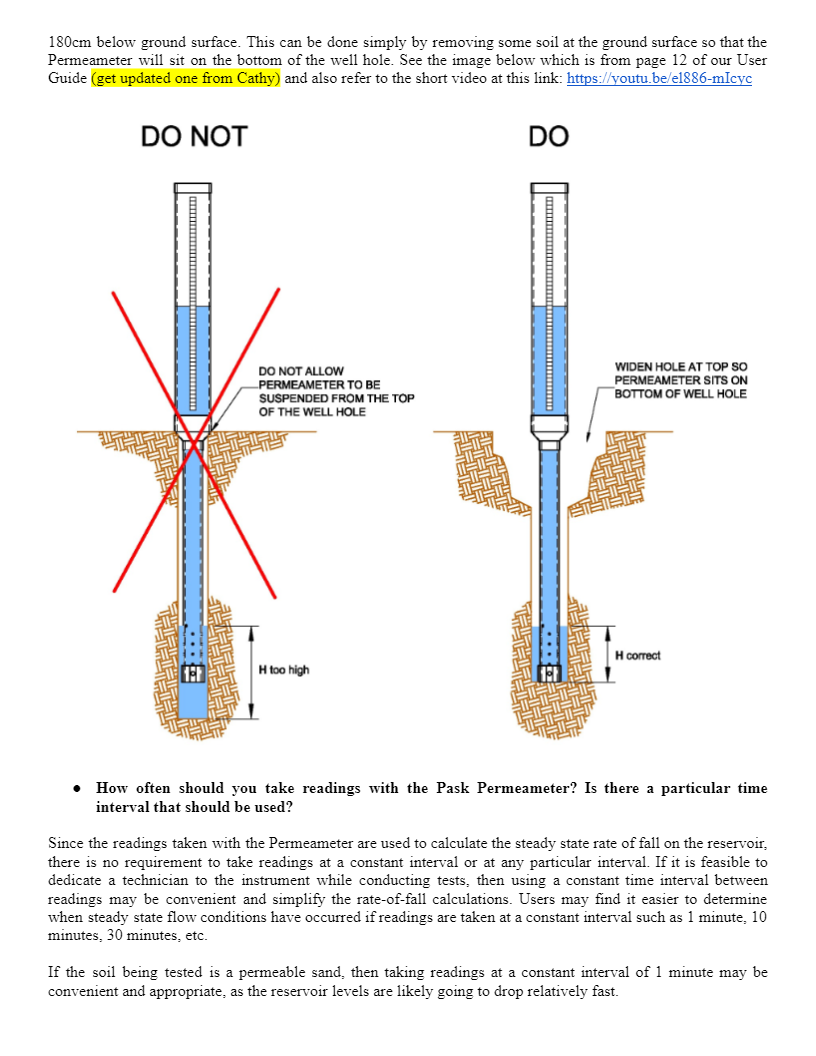
However, many of our satisfied customers conduct tests with the Standard Pask to depths of 90cm and even to 180cm below ground surface. This can be done simply by removing some soil at the ground surface so that the Permeameter will sit on the bottom of the well hole. See the image below which is from page 12 of our User Guide (get updated one from Cathy) and also refer to the short video at this link: https://www.youtube.com/watch?v=el886-mIcyc
![]()
Since the readings taken with the Permeameter are used to calculate the steady state rate of fall on the reservoir, there is no requirement to take readings at a constant interval or at any particular interval. If it is feasible to dedicate a technician to the instrument while conducting tests, then using a constant time interval between readings may be convenient and simplify the rate-of-fall calculations. Users may find it easier to determine when steady state flow conditions have occurred if readings are taken at a constant interval such as 1 minute, 10 minutes, 30 minutes, etc.
If the soil being tested is a permeable sand, then taking readings at a constant interval of 1 minute may be convenient and appropriate, as the reservoir levels are likely going to drop relatively fast.
However, for fine grained, silty and clayey soils, which are often slowly permeable, a 1 minute interval between readings is probably too short, as the drop in water level between readings may only be a few millimeters. Very small drops between readings are more difficult for technicians to discern, and could lead to a loss of accuracy. Therefore, when testing slowly permeable soils, it is recommended to use a time interval sufficiently long enough to result in a significant, discernable drop (e.g. > 1 cm) between readings. A time interval of 1 hour or more between readings may be appropriate.
If you have purchased the Comprehensive Pask Permeameter Kit, then it is recommended to use the Slow Soil Pask Permeameter included with that kit when testing slowly permeable soils. The smaller diameter reservoir will result in a larger drop between readings than with the Standard Pask Permeameter.
Again, it is not necessary to use a constant time interval between readings. It is also not a problem to miss some planned readings if you choose to take them at a constant time interval. Simply take the missed reading as soon as you can, noting the actual time when the reading was taken, and calculate the rate of fall for the larger time interval. Alternatively, just skip the missed reading and resume constant readings at the next planned interval.
It is also not a problem to start with one time interval and change to a different interval during the test. What is most important is that the test runs long enough so that steady state flow conditions are achieved. As discussed in the User Guide, steady state flow can be assumed after getting three to five consecutive rate-of-fall readings which are the same.
Most augers will create a slightly larger hole than the nominal diameter of the auger. We have already done the work to figure this out by making and measuring concrete casts of auger well holes. We found that the 2-3/4″ (7cm) Riverside auger that comes with our kit results in a typical well hole diameter of 8.3cm. If your augers will result in a different diameter hole, you will need to measure this and let us know. We need this information to prepare custom quick field reference tables which will be appropriate for use with your augers. Many busy consulting firms find this is not worth the hassle for $150, which is another reason why most order the complete kit.
Users of the constant head well permeameter method can conclude that steady state conditions have been achieved when the flow rate into the soil (rate of fall on the reservoir) is approximately constant for a minimum of three to five successive readings.
In more specific mathematical terms, steady state equilibrium has been achieved when the change in discharge rate is less than 10% of the median value for three consecutive discharge readings.
Alternatively, when the flow rate reaches quasi-steady state conditions it varies around an average value. To determine this average, plot the rate of fall on the reservoir (or the calculated Kfs values) against the time and pass a smooth curve through them using a manually or mathematically best-fitting curve. Steady state flow is reached if the tail end of this curve is nearly horizontal and does not indicate an upwards or downwards trend.
From paper by Laurence Gill and Joanne Mac Mahon(reference)
The geometric mean infiltration volume (rate of fall on the reservoir) for the last three measurements after steady state has been reached is used to calculate Kfs. Kfs is not normally distributed and so the geometric mean of steady state flow rate measurements should be used for calculations.
For example, the geometric mean of the number set {1.80,1.50, 1.43} would be as follows: √3 1.80 x 1.50 x 1.43 = 1.57
Whereas the arithmetic mean of the same number set would be as follows: (1.80 + 1.50 + 1.43) / 3 = 1.58