Perc Test Outdated
The Percolation Test (PT) rate of fall or “Perc Time” is still used in many jurisdictions to determine suitability for onsite sewage disposal or for sizing of soil absorption systems (drainfields) and stormwater infiltration BMPs. It has been understood for some time, that Perc Time is not ideal because it is not just a function of soil permeability, but also a function of test conditions.
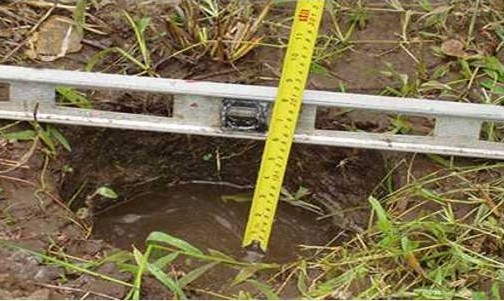
The outdated percolation test does not control for variables that can substantially affect the test results.
Field Saturated Hydraulic Conductivity a True Soil Characteristic
The field saturated hydraulic conductivity, Kfs, determined using the Constant Head Well Permeameter (CHWP) technique (Figure 1), is a much more scientifically and technically sound indicator of soil permeability than the outdated Perc Test. Kfs testing controls for variables that can substantially affect the Perc Time such as pit/borehole dimensions, depth of water ponding, soil capillary properties, and background soil moisture content at the time of the test.
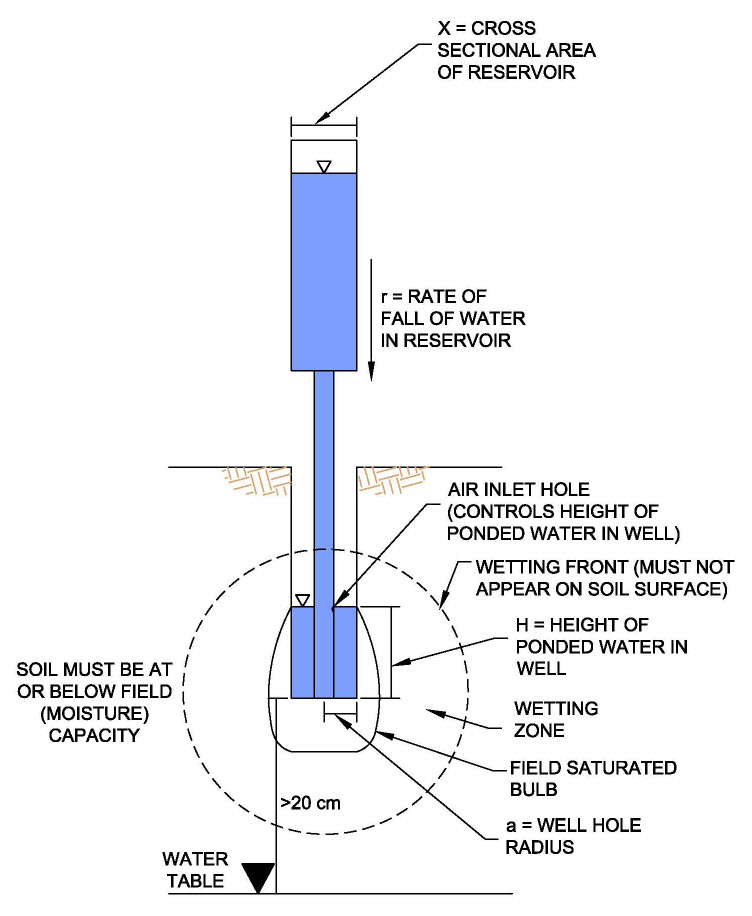
Figure 1 Constant Head Well Permeameter (CHWP) method.
Methods of Relating Perc Time to Hydraulic Conductivity
Various correlations between Perc Time (PT) and field-saturated hydraulic conductivity (Kfs) have been proposed. Reynolds et al (2015) analysed six Perc Time versus Kfs correlations from Virginia, Georgia, Connecticut, and Ontario, Canada. None of the correlations were found to be generally applicable, accurate or scientifically defensible, in part because they did not completely describe the factors affecting Perc Time and Kfs.
New Expression Relating Perc Time to Kfs
An accurate and physically-based analytical expression relating Perc Time to Kfs for cylindrical test holes was proposed by Dr. Dan Reynolds, Soil Scientist with Agriculture Canada, who along with Dr. David Elrick, developed and published widely on the CHWP method. This new expression is described in detail by Reynolds et al (2015) and was also presented by Kelly Galloway, P.Eng. at the 2015 Annual Conference of the National Onsite Wastewater Recycling Association (NOWRA), West Virginia Beach.
Using this new analytical expression, it is now possible to show the relationship between Perc Time and Kfs. A procedure has been described which shows how to determine Perc Time from Kfs using the extended single-ponded height CHWP method (which is directly comparable to, but an improvement on the original single-head Glover analysis).
Simplified Procedure to Determine Perc Time from Kfs (and vice versa)
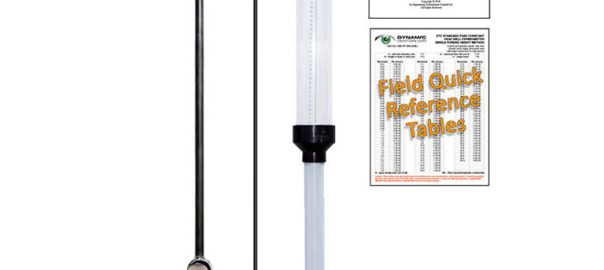
A summary of a simplified procedure to determine Perc Time from Kfs which is applicable to the ETC Pask Permeameter kit is outlined below. Refer to Reynolds et al (2015) for a detailed discussion of the factors and applicability of the newly developed Kfs-to-PT relationship and for a similar procedure to determine Kfs from Perc Time.
Step 1: Determine Kfs and α* using the Single-Head method outlined in the ETC Pask Permeameter User Guide.
Step 2: Determine the appropriate Kfs to PT conversion factor, m, from Table 1.0 below.
Step 3: Determine the “equivalent” Perc Time (in units of minutes/inch or minutes/cm) that corresponds to the H, d (a), α* and Kfs values, using the relationship, PT = m/Kfs, where Kfs is in meters/sec.
The calculated Perc Time value is referred to as “equivalent” because borehole water level is held constant (at H) by the CHWP, thereby preventing direct measurement of PT = ∆t/∆H.
Table 1.0: Conversion factor, m, relating Perc Time (PT) to Kfs for constant head, H=15.0cm and approx. well hole diameter, d=8.3cm. PT=m/Kfs, where Kfs is in meters/sec.
| Capillarity Category | Representative α* (cm-1) |
m (for PT in min/cm) | m (for PT in min/inch) |
| Negligible | 1.0 | 7.74E-06 | 1.97E-05 |
| Weak | 0.36 | 7.00E-06 | 1.78E-05 |
| Moderate | 0.12 | 5.39E-06 | 1.37E-05 |
| Strong | 0.04 | 3.18E-06 | 8.07E-06 |
| Very Strong | 0.01 | 1.05E-06 | 2.68E-06 |
It must be emphasized that the conversion factors given in Table 1.0 apply only to the well characteristics indicated above. Alternative conversion tables applicable to other auger/well hole sizes and constant heads may be ordered from Dynamic Monitors, or they may be derived using the procedure outlined in Reynolds et al (2015).
REFERENCES